
Step 1: Review the Registrants Table
Start on the Registrants page, which serves as your main homepage for registrant management. Here you will see a table listing all current registrants, including their status and key submission details such as when their registration was updated or submitted, and whether they were added, registered, are in payment processing, or have just submitted and are waiting for payment to be completed.
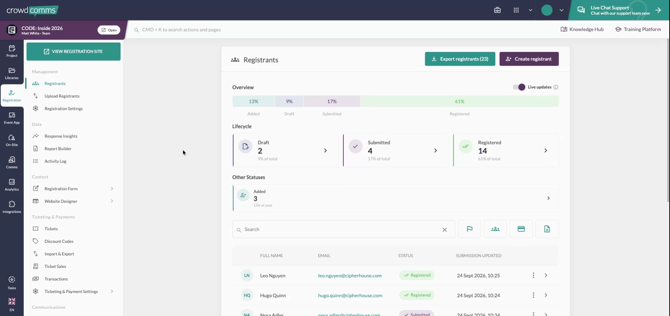
This table helps you quickly understand the state of each registration. You can see statuses such as added, registered, and payment processing.
Step 2: Filter Registrants in the Table
Use the built-in filters on the Registrants page to narrow down the list by:
- Status
- Group
- Payment status
- Responses to registration questions
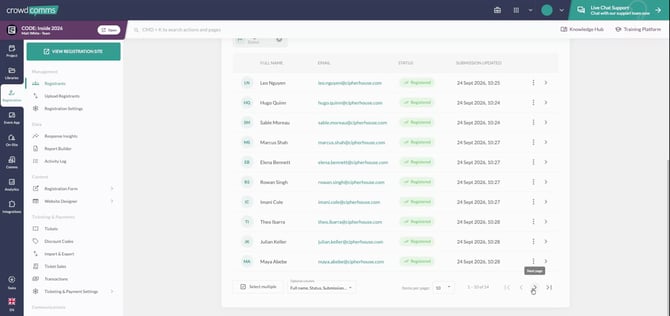
For example, apply a filter to show only registrants whose status is Registered.
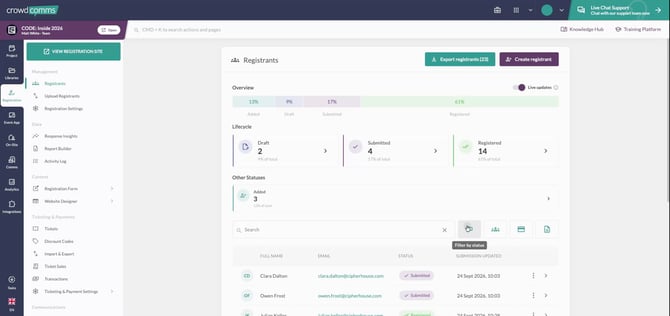
Select the appropriate status option so you can see everyone who has successfully registered.
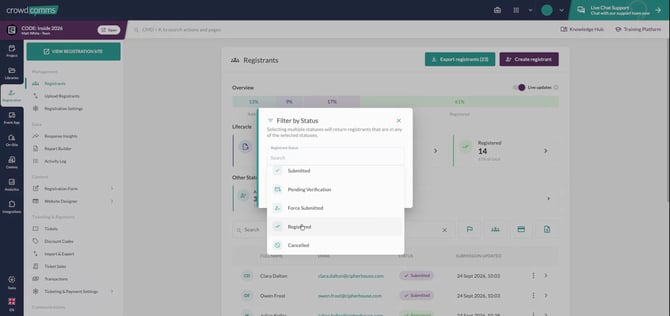
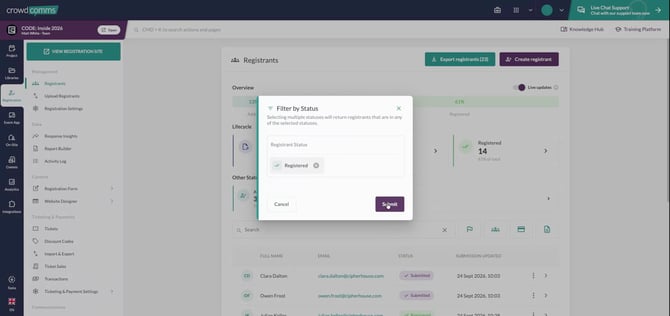
After applying this filter, review the filtered results. In this example, there are fourteen users who have all registered.
Step 3: Use the Activity Log to Track Changes
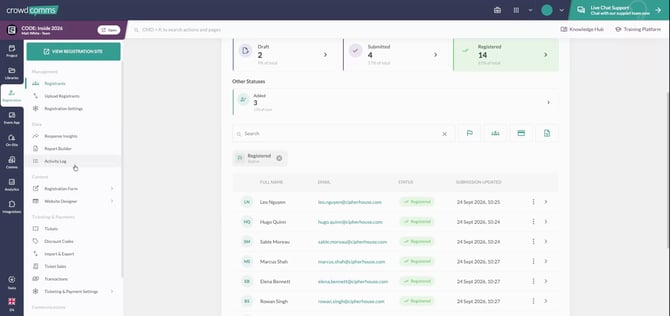
Open the Activity Log to see a detailed history of actions for your registrants.
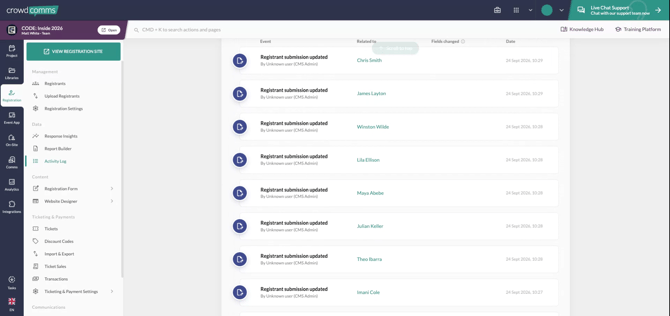
The Activity Log shows:
- When a registrant updated their information
- When they registered
- The exact time of each action
- Who performed the action
This provides a clear, easy-to-read timeline of registration activity.
Step 4: Open the Report Builder for Advanced Analysis
Access the Report Builder to create more advanced, customised reports based on:
- Registrant responses
- Registrant types
- Various filters on user data
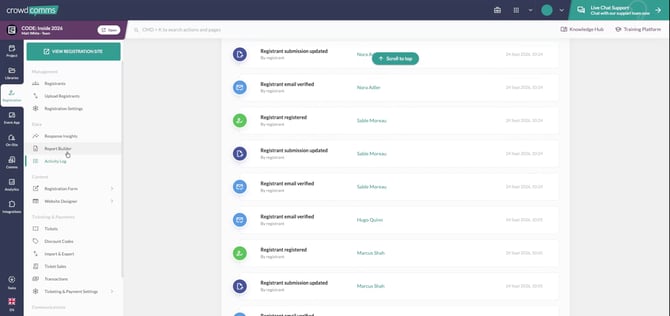
The Report Builder allows you to deep dive into specific segments of your users.
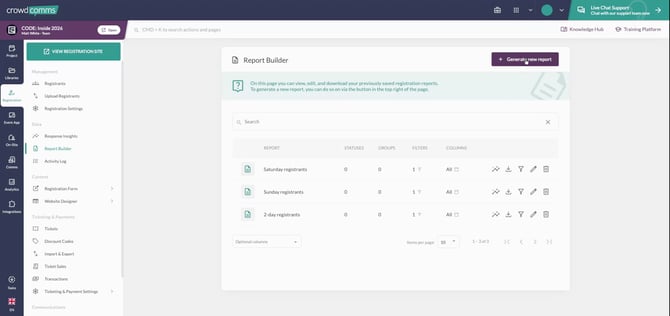
Step 5: Create a New Report for Registered Attendees
In the Report Builder, start creating a new report.
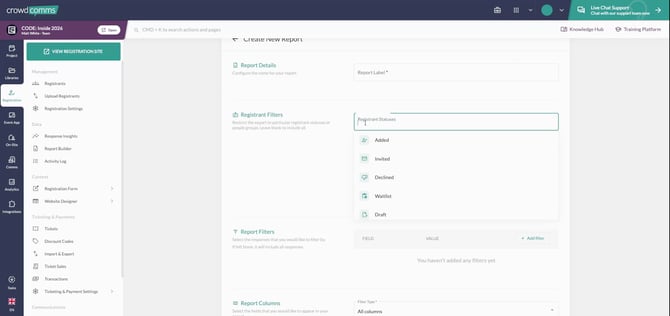
Configure the report to include anyone who has registered.
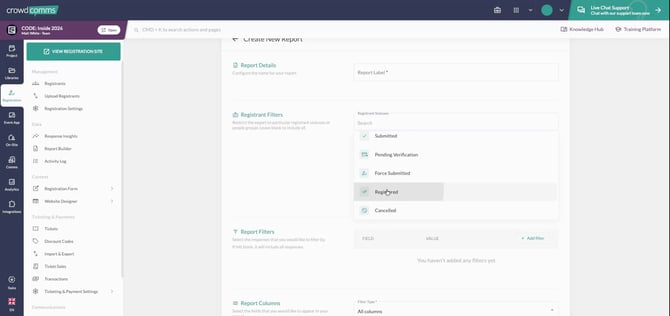
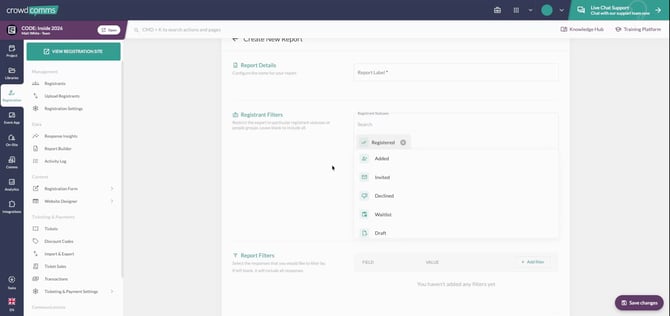
If registrant groups are not in use for your event, you can leave those fields as they are.
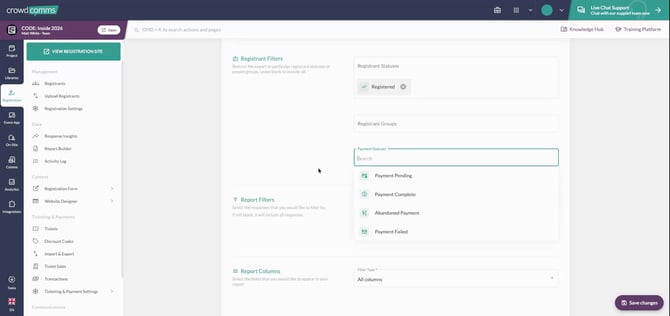
Next, refine the report by payment status, such as pending, completed, abandoned, or failed, if needed.
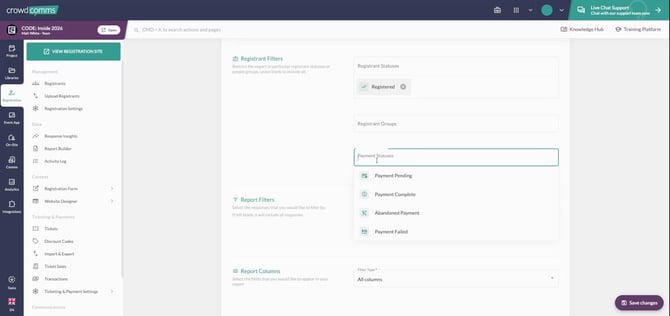
For this example, focus only on who has registered, regardless of payment status by leaving the field blank.
Step 6: Add a Filter and Name the Report
Further filter your new report by a specific question—for example, Dietary Restrictions.
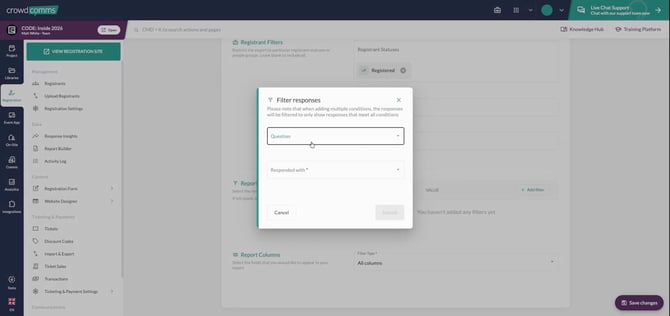
Select the dietary restrictions question from the list of available questions.
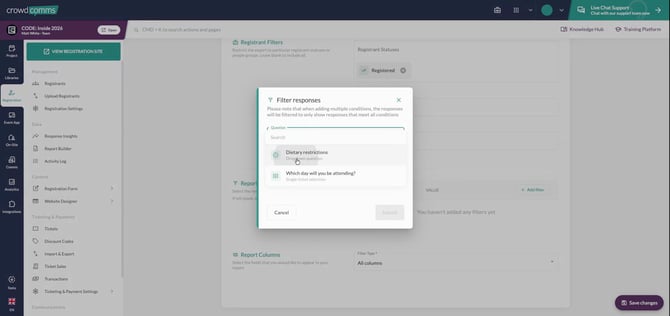
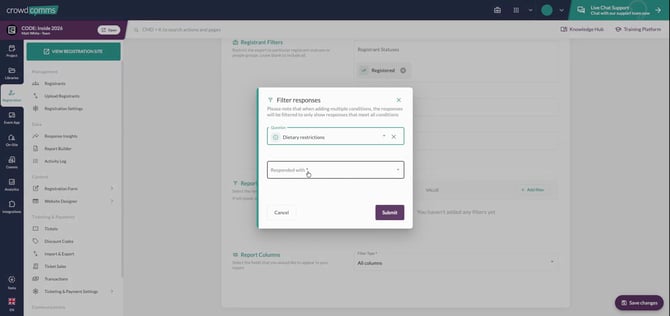
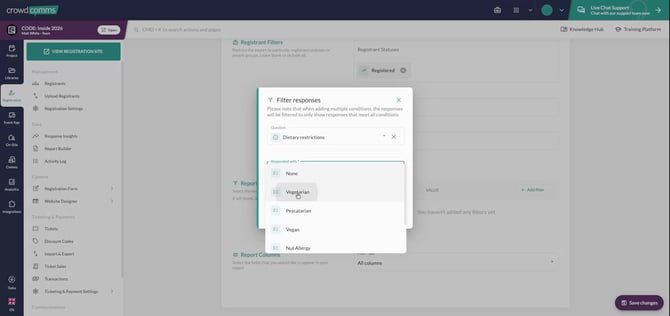
Set the condition to identify registrants who are vegetarian.
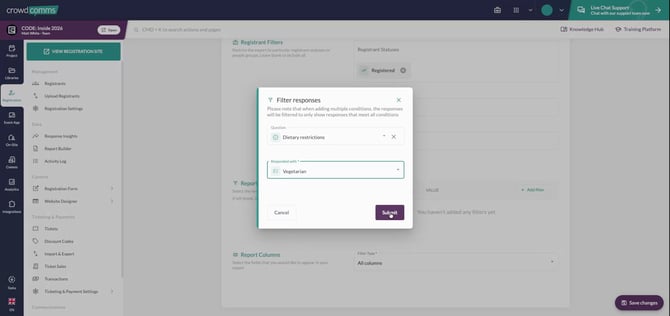
Then, give your report a clear, descriptive name such as Vegetarian Registrants so you can easily find it later.
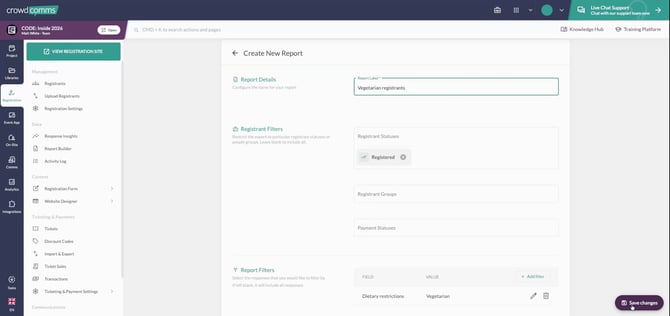
Finally, save the report.
Step 7: View Overall Response Insights
Navigate to Response Insights to view aggregated data from your registration form.
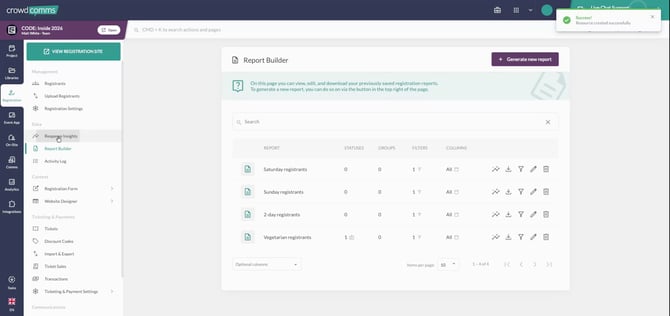
Here, you can:
- See who has indicated any dietary restrictions
- Review counts for ticket choices such as one-day, two-day, or weekend tickets
This view helps you understand overall response trends across your registrants.
Step 8: Apply Your Custom Report Filter in Response Insights
Within Response Insights, apply a filter using your newly created Vegetarian Registrants report.
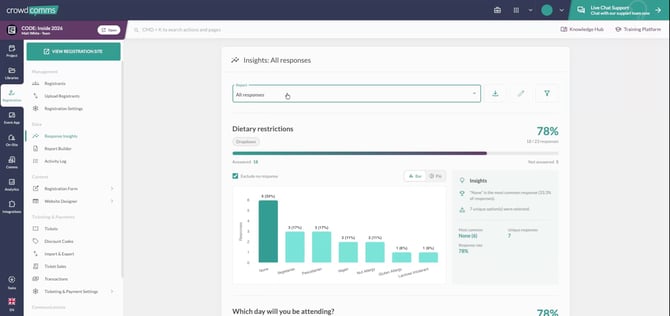
Select the vegetarian registrants filter to narrow the insights to only those attendees.
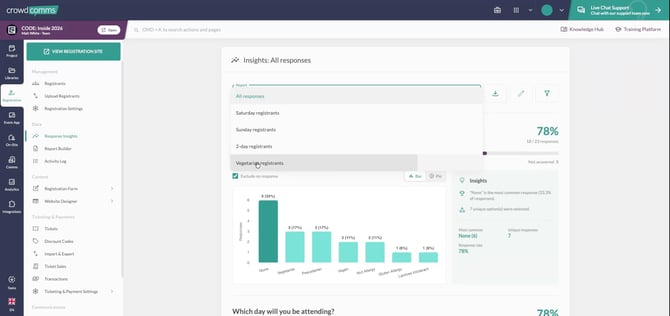
You can now see, the number of registrants attending the event who are vegetarian, giving you a clearer understanding of this subset of your data.
Step 9: Change Visualisation Type and Edit the Report
Adjust how the data is visualised within Response Insights. For instance, switch from bar charts to pie charts if that better suits your analysis or presentation needs.
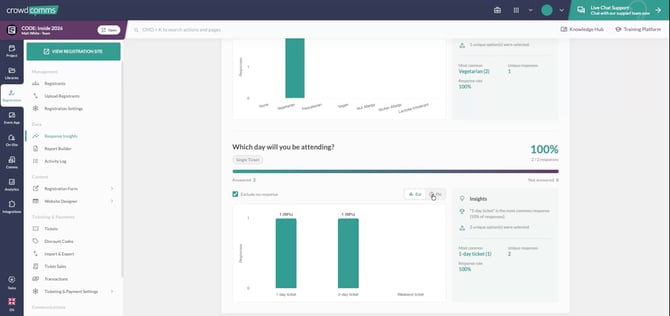
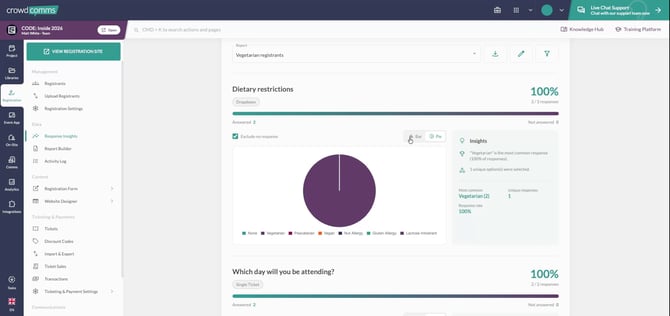
Step 10: Export and Drill Down to Individual Registrants
From the Response Insights view, you can:
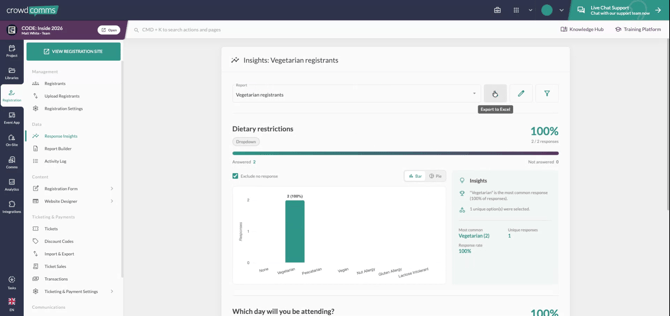
- Export the report for offline analysis or sharing.
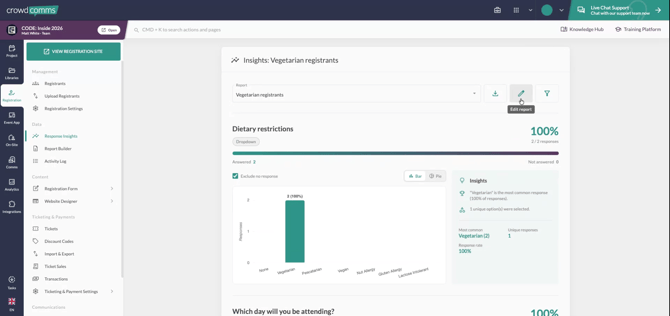
- Edit report, via the Report Builder that you initially created this with.
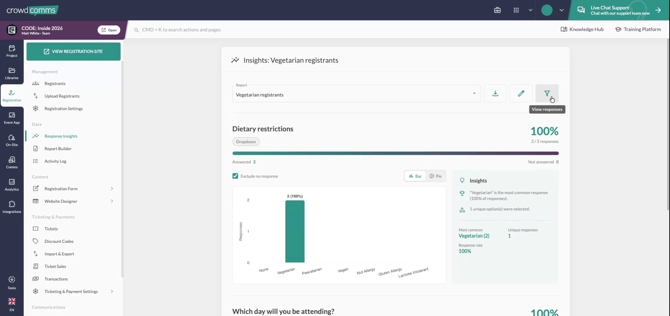
- View the responses, which sends you back to the Registrants page with all relevant filters already applied. This lets you see the names and details of the individual people behind the aggregated data.
The Report Builder, combined with Response Insights and the Activity Log, is a powerful set of tools for deeply understanding and visualising registration data from your event site.